
Isolation and identification of fungi
Xiaozhou mustard root tubers rotted when infected by the pathogen before harvest (Fig. 1A) and during drying after harvest (Fig. 1B). The common symptoms of the diseased root tuber included a brown, watery, and soft decay with a thin layer of white mycelia grown on root tubers surface, subsequently, the middle part of the lesion became dark in later stages. The pathogen from a typical rotten root tuber was separated and purified by growth on potato dextrose agar (PDA). After 5 days culture at 28 °C in darkness, two purified fungal isolates on PDA were white, creamy, spreading, flat and smooth (Fig. 1D, F) with a pale yellow reverse side (Fig. 1E, G). A round bulge was also observed in the center of the colony. Both isolates showed similar colony, mycelium, and conidia morphologies. The end of the mycelium was broken into single spores or spore chains when mature. Moreover, cylindrical, barrel-shaped, or ellipsoidal single-cell arthrosporous were found, and the conidia size ranged from approximately 3.2–27.8 μm × 2.8–3.2 μm (n = 50) (Fig. 1H–J). Morphological features were consistent with Geotrichum candidum (G. candidum) as described by Thomidis et al.
Symptoms of naturally rotted root tubers and morphological aspects of the species G. candidum on potato dextrose agar (PDA). (A) Naturally rotted root tuber. (B) Rotted root tuber during drying. (C) The control root tuber (Red arrow) and the root tuber 8 days after inoculation with fungi in the field (Yellow arrow). (D) Colony of G. candidum R01 on PDA after seven days of growth. (E) Reverse colony of G. candidum R01 on potato dextrose agar. (F) Colony of G. candidum R02 on PDA after 7 days of growth. (G) Reverse colony G. candidum R02 on potato dextrose agar. (H) Fungal spores of G. candidum R01 (two types of spore, one was long tube-shaped, another was ellipsoidal oval and hyphae). (I) Long tube-shaped spore of G. candidum R01. (J) Long tube-shaped spore of G. candidum R02. Scale bars: (H–J) = 20 μm.
The DNA fragment was successfully amplified by using total genomic DNA as the template. A DNA-ITS sequence measuring approximately 400 base pairs was acquired from the two isolated DNA samples (Fig. 2A). Subsequently, sequenced the ITS of the two genes and aligned with entries in the National Center for Biotechnology Information (nih.gov) (http://www.ncbi.nlm.nih.gov). The BLASTn results showed that the obtained ITS region sequences from G. candidum R01 and G. candidum R02 all showed 100% identity with G. candidum strain KT336519.1. Thus, the two strains isolated are the same strain, which corroborated the morphological identification. Phylogenetic analysis results indicated that the isolated colonies were clustered with the G. candidum clade (Fig. 2B). Based on morphological and phylogenetic analyses of the ITS domain, the two isolates were identified as G. candidum. The EF-1α gene sequences were also amplified by PCR with EF1-728 F and EF1-986R primers (Fig. 2A). The representative sequences were submitted to GenBank and results suggested that the EF-1α sequence was 98% similar to a strain of Geotrichum candidum (accession numbers MT346370.1 and MT346368.1). Phylogenetic analysis results indicated that the isolated colonies were clustered with the G. candidum clade (Fig. 2C). Therefore, the isolate was identified as G. candidum R01.

Molecular identification of the fungal strain. (A) PCR results of ITS and EF-1α. (B) Phylogenetic tree based on nuclear ribosomal DNA-ITS region. (C) Phylogenetic tree based on the EF-1α region; M Marker DL 2000. (1, 2) Two replicates of ITS sequence. (3, 4) Two replicates of EF-1α sequence.
In Koch’s postulate experiments, healthy Xiaozhou mustard root tubers were inoculated with G. candidum in the field. The root tubers inoculated by G. candidum developed white rot symptoms and formed a layer of white mycelium after 8 days inoculation (Fig. 1C, yellow arrow), while no similar symptoms were observed in Xiaozhou mustard root tubers uninoculated with G. candidum (Fig. 1C, red arrow). All pathogens were re-isolated from artificially inoculated root tubers and exhibited the same morphological characteristics as the original isolate, as well as ITS gene sequences, fulfilling Koch’s postulates. The two fungal strains (G. candidum R01 and G. candidum R02) caused root tubers disease but no profound differences were observed between two isolate occurrences in root tuber tissue. Therefore, G. candidum R01 strain was selected for subsequent experiments in this work.
Antifungal activity of Cl-F-BBA against G. Candidum R01
After 5 days incubation in Cl-F-BBA, inhibition rate of mycelial growth in proportion to Cl-F-BBA concentration was increased significantly (Fig. 3A). The application of 0.10, 0.15, 0.20 and 0.25 mg/mL Cl-F-BBA induced mycelia growth inhibition rate by 73.93%, 84.31%, 96.27% and 100% of the control (p ˂ 0.05), respectively (Fig. 3B). Thus, 0.25 mg/mL Cl-F-BBA completely inhibited the colony expansion, with an EC50 value of 87.71 µg/mL. However, no significant difference in mycelial discs diameter was observed between 0.05 mg/mL Cl-F-BBA treated group and the control (Fig. 3A). Furthermore, 0.10, 0.15, 0.2, and 0.25 mg/mL Cl-F-BBA increased relative germination inhibition rates of spore significantly and recorded as 78.33%, 89.03%, 97.11% and 100% (p ˂ 0.05), respectively (Fig. 3C). In addition, Cl-F-BBA also demonstrated an effective inhibitory activity against Monilinia fructicola (M. fructicola), Aspergillus ochraceus (A. ochraceus), and Penicillinum citrinum (P. citrinum), with EC50 values of 32.98, 55.83, and 61.56 µg/mL, respectively (Additional file 1: Fig. S1, Table S1).

Effect of Cl-F-BBA on the mycelial growth inhibition rate (A, B) and relative germination inhibition rate of spore (C) of G. candidum R01. Different lowercase letters indicate significant differences (p < 0.05). Data are mean ± SD (n = 3).
Cl-F-BBA destroys the plasma membrane integrity and mycelial structure of G. Candidum R01
Propidium iodide (PI), a fluorescent molecule, is membrane impermeable and can bind to DNA, therefore, cell stained by PI can be used to quantify cell membrane damage. In the present study, significantly increased red signal intensity in mycelia and spores after treated with 0.20 mg/mL Cl-F-BBA were observed compared to the control (Fig. 4), indicating that Cl-F-BBA treatment damaged the cell membrane integrity of G. candidum R01 mycelia and spores.

Spores and mycelia of G. candidum R01 stained by PI. (A, E) Spores in control. (B, F) Mycelia in control. (C, G) Spores treated with 0.20 mg/mL Cl-F-BBA. (D, H) Mycelia treated with 0.20 mg/mL Cl-F-BBA. Scale bar = 20 μm.
The effect of Cl-F-BBA on G. candidum R01 mycelia morphology was also investigated by Scanning electron microscopy (SEM). The mycelial morphology of the control group showed a tubular, regular, homogeneous and smooth surface (Fig. 5A), whereas the groups treated with 0.20 mg/mL Cl-F-BBA showed irregular, twisted, and collapsed mycelia with a rough surface (Fig. 5B).
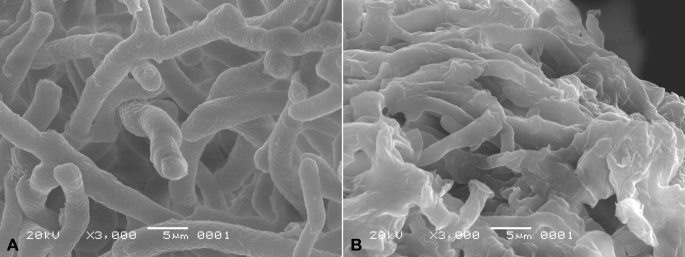
SEM images of G. candidum R01 mycelial morphology. (A) Mycelia in control. (B) Mycelia treated with 0.2 mg/mL Cl-F-BBA. Scale bar = 5 μm.
The membrane integrity of G. candidum R01 spores stained by PI was also determined by flow cytometry and was presented in two-dimensional dot plots (Fig. 6). It was showed that homogenous population of undamaged cells dominated in control group, while variations in cell sizes (forward scatter, [FSC]) and complexity (side scatter, [SSC]) were observed on scatter gram of G. candidum R01 spores after 12 h incubation in 0.2 mg/mL Cl-F-BBA. Moreover, PI-stained spores accounted for 6.98% of the total spores in the control (Fig. 6B, b), while the percentage of PI-stained spores treated by 0.20 mg/mL Cl-F-BBA increased to 90.42% (p < 0.05) (Fig. 6C and D), indicating that Cl-F-BBA can destroy the cell membrane integrity of G. candidum R01 spore.

The membrane integrity of G. candidum R01 spores determined by flow cytometry after treated with Cl-F-BBA. (A–C) Cell complexity (SSC) vs. cell size (FSC) showed by scatter gram. (a–c) PI-stained spores percentage of the control. (A, a) Autofluorescence of normal cells. (B, b) Fluorescence of normal cells for PI staining. (C, c) Spores treated with Cl-F-BBA. (D) PI-stained spores percentage after Cl-F-BBA treatment.
Cl-F-BBA damages the mitochondrial activity of G. Candidum R01
Compared to the spores (Figs. 5E and 7A) and mycelia (Fig. 7B, F) in the control group of G. candidum R01, the spores (Fig. 7C, G) and mycelia (Fig. 7D, H) treated with 0.20 mg/mL Cl-F-BBA showed reduced mitochondrial red fluorescence staining intensity, indicating the destruction of the active mitochondria.
In addition, the green fluorescence intensity of Rhodamine 123 was higher in the spores (Fig. 7I, M) and mycelia (Fig. 7J, N) in the control group, however, the green fluorescence intensity of Rhodamine 123 were significantly reduced both in the spores (Fig. 7K, O) and mycelia (Fig. 7L, P) after treated with 0.20 mg/mL Cl-F-BBA, suggesting that Cl-F-BBA can destroy the mitochondrial membrane structure and cause the mitochondrial dysfunction in G. candidum R01 cells.

G. candidum R01 stained with the mitochondrial red fluorescence probe and Rhodamine 123. (A, E) Spores in control. (B, F) Mycelia in control. (C, G) Spores treated with 0.20 mg/mL Cl-F-BBA. (D, H) Mycelia treated with 0.2 mg/mL Cl-F-BBA. (I, M) spores in control. (J, N) mycelia in control. (K, O) spores treated with 0.2 mg/mL Cl-F-BBA. (L, P) mycelia treated with 0.2 mg/mL Cl-F-BBA. Scale bar = 20 μm.
Cl-F-BBA decreases fungal respiration and the activities of MDH and SDH
Cl-F-BBA incubation significantly decreased the respiratory rate of G. candidum R01 (Fig. 8A). Thus, oxygen consumption rate was reduced by 18.56%, 41.61% and 63.17% of the control after Cl-F-BBA treatment for 12, 24 and 36 h. Meanwhile, Cl-F-BBA treatment caused 21.23%, 46.68% and 60.07% reduction of the control in the activity of malate dehydrogenase (MDH), and 38.12%, 60.84% and 73.96% reduction in succinate dehydrogenase (SDH) activity after 12, 24 and 36 h treatment (Fig. 8B, C). The decreases in the activities of two enzymes suggested that mitochondrial function was destroyed by Cl-F-BBA treatments.
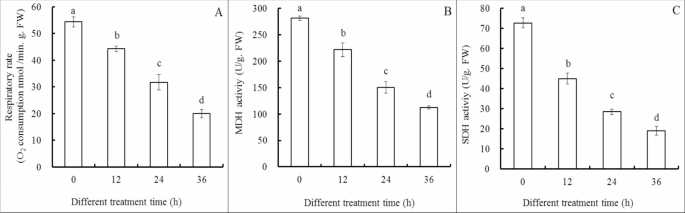
Cl-F-BBA decreases respiration, activities of MDH and SDH in G. candidum R01 cells. (A) Respiratory rate, (B) MDH activity, (C) SDH activity. Different letters above the bars indicate significant differences according to one-way analysis of variance (ANOVA), followed by Tukey’s test (P < 0.05).
Cl-F-BBA changes the contents of ATP, ADP, AMP and energy charge
Compared to the control, 0.20 mg/mL Cl-F-BBA decreased ATP content by 40.75% (p < 0.05) but increased ADP and AMP content by 23.47% and 273.72%, respectively (p < 0.05). Moreover, the energy charge decreased significantly in G. candidum R01 cells treated by 0.2 mg/mL Cl-F-BBA and was recorded as 25.64% compared to the control (p < 0.05) (Fig. 9).
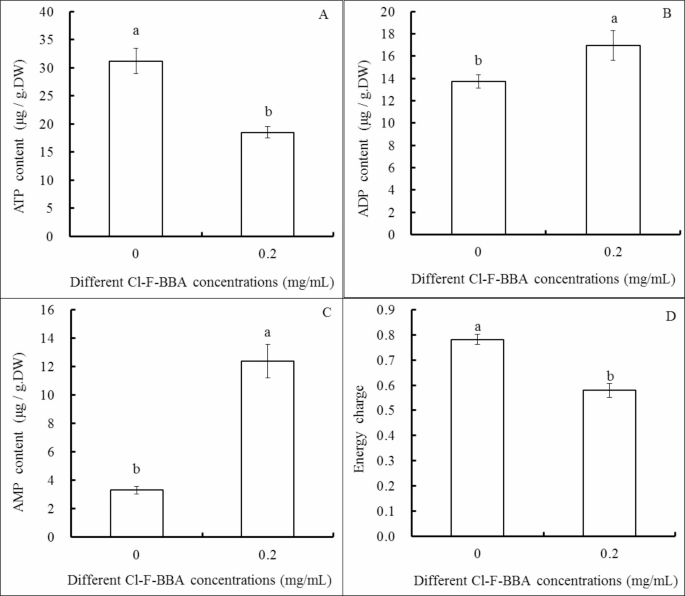
Effects of Cl-F-BBA on the contents of ATP (A), ADP (B), AMP (C) and energy charge (D) in G. candidum R01 cells. Different letters above the bars indicate significant differences according to one-way analysis of variance (ANOVA), followed by Tukey’s test (P < 0.05).
Cl-F-BBA disorder the antioxidant metabolism
The antioxidant enzymes activities of superoxide dismutase (SOD) (Fig. 10A) and catalase (CAT) (Fig. 10B) were significantly decreased in a time-dependent manner during 36 h Cl-F-BBA incubation. For instance, SOD activity was reduced by 20.74%, 42.01% and 73.07% of the control after Cl-F-BBA treatment for 12, 24 and 36 h. However, peroxidase (POD) activity was increased by 41.65% of the control after 12 h Cl-F-BBA exposure, then decreased by 42.31% and 72.84% of the control after 24 and 36 h exposure, respectively (Fig. 10C). Moreover, malondialdehyde (MDA) content was increased by 1.35-, 2.41-, and 2.83-times of the control group after 12, 24, and 36 h of Cl-F-BBA exposure, respectively (p < 0.05) (Fig. 10D). The decreased antioxidant enzymes and the increased MDA content suggested that Cl-F-BBA exposure reduced the antioxidant activity, which reduced the rate of ROS scavenging, caused the accumulation more reactive oxygen species (ROS) in the spore and mycelia (Fig. 11B, D), and further caused oxidative stress and led to cell membranes damage.
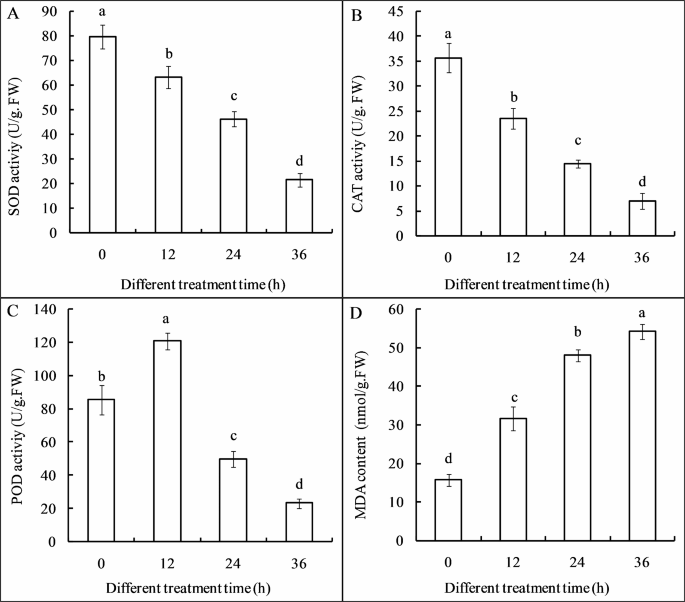
Effects of Cl-F-BBA on antioxidant enzymes activities and MDA content in G. candidum R01 mycelia. (A) SOD activity, (B) CAT activity, (C) POD activity, (D) MDA content. Different letters above the bars indicate significant differences according to one-way analysis of variance (ANOVA), followed by Tukey’s test (P < 0.05).
A specific fluorescent probe, H2DCFDA, was used to detect endogenous ROS in fungal cell. As showed in (Fig. 11), the fluorescence intensity of H2DCFDA was very weak in the cell of G. candidum R01 (Fig. 11A, C) in the control group. However, the cell of Cl-F-BBA treated group (Fig. 11B, D) showed extensive green fluorescence. In the meanwhile, ROS accumulation was also found in cell membranes of mycelia and spores, suggesting the cell membranes may be the target of ROS, and thus leads to more easy attack lipids in the membrane and induces lipids oxidation.

Effects of Cl-F-BBA on ROS accumulation in the spore and mycelia of G. candidum R01. (A, C) Control group. (B, D) 0.2 mg/mL Cl-F-BBA treated group for 36 h. Scale bar = 50 μm.
Cl-F-BBA increases intracellular content leakage in mycelia
The electrical conductivity increased by 1.58-, 2.09-, and 2.21 times of the control group after 4, 8, and 12 h Cl-F-BBA exposure (Fig. 12A), respectively (p < 0.05). The leakage of soluble sugar (Fig. 12B) and protein (Fig. 12C) in mycelia were both increased significantly after Cl-F-BBA treatment as compared with the control.
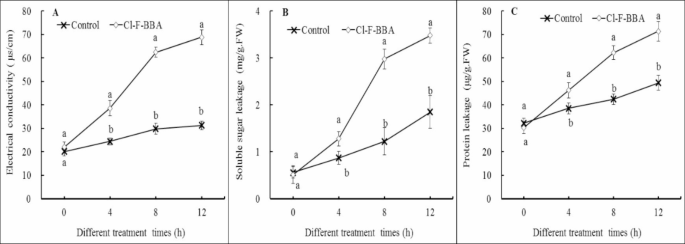
Effects of Cl-F-BBA on intracellular content leakage and the contents of soluble sugar and protein in G. candidum R01 mycelia. (A) Electrical conductivity. (B) Soluble sugar. (C) Protein. Different letters above the bars indicate significant differences according to one-way analysis of variance (ANOVA), followed by Tukey’s test (P < 0.05).
Cl-F-BBA against Xiaozhou mustard root tuber sour rot caused by G. Candidum R01
Rot lesions were decreased significantly in Xiaozhou mustard root tubers treated with Cl-F-BBA after 8 days inoculation with G. candidum R01 spores. The rot lesion diameter in the root tubers treated with 0.25, 0.50, 1.0 and 1.50 mg/mL Cl-F-BBA was decreased by 46.78%, 70.05%, 86.63%, and 100% (p < 0.05) of the control, respectively (Fig. 13A). In addition, the decay rate of root tubers was decreased significantly and disease occurrence was eliminated completely under 1.5 mg/mL Cl-F-BBA treatment (Fig. 13B). In the meanwhile, Cl-F-BBA also showed an excellent antifungal-efficacy on root tuber slices after inculated with G. candidum R01 (Additional file 2: Fig. S2). These data suggest that Cl-F-BBA is effective in against G. candidum R01 caused sour rotten in Xiaozhou mustard root tuber.

Cl-F-BBA treatment inhibited G. candidum R01 virulence on harvested Xiaozhou mustard root tuber. (A) Lesion diameter. (B) Decay rate. Different letters above the bars indicate significant differences according to one-way analysis of variance (ANOVA), followed by Tukey’s test (P < 0.05).


